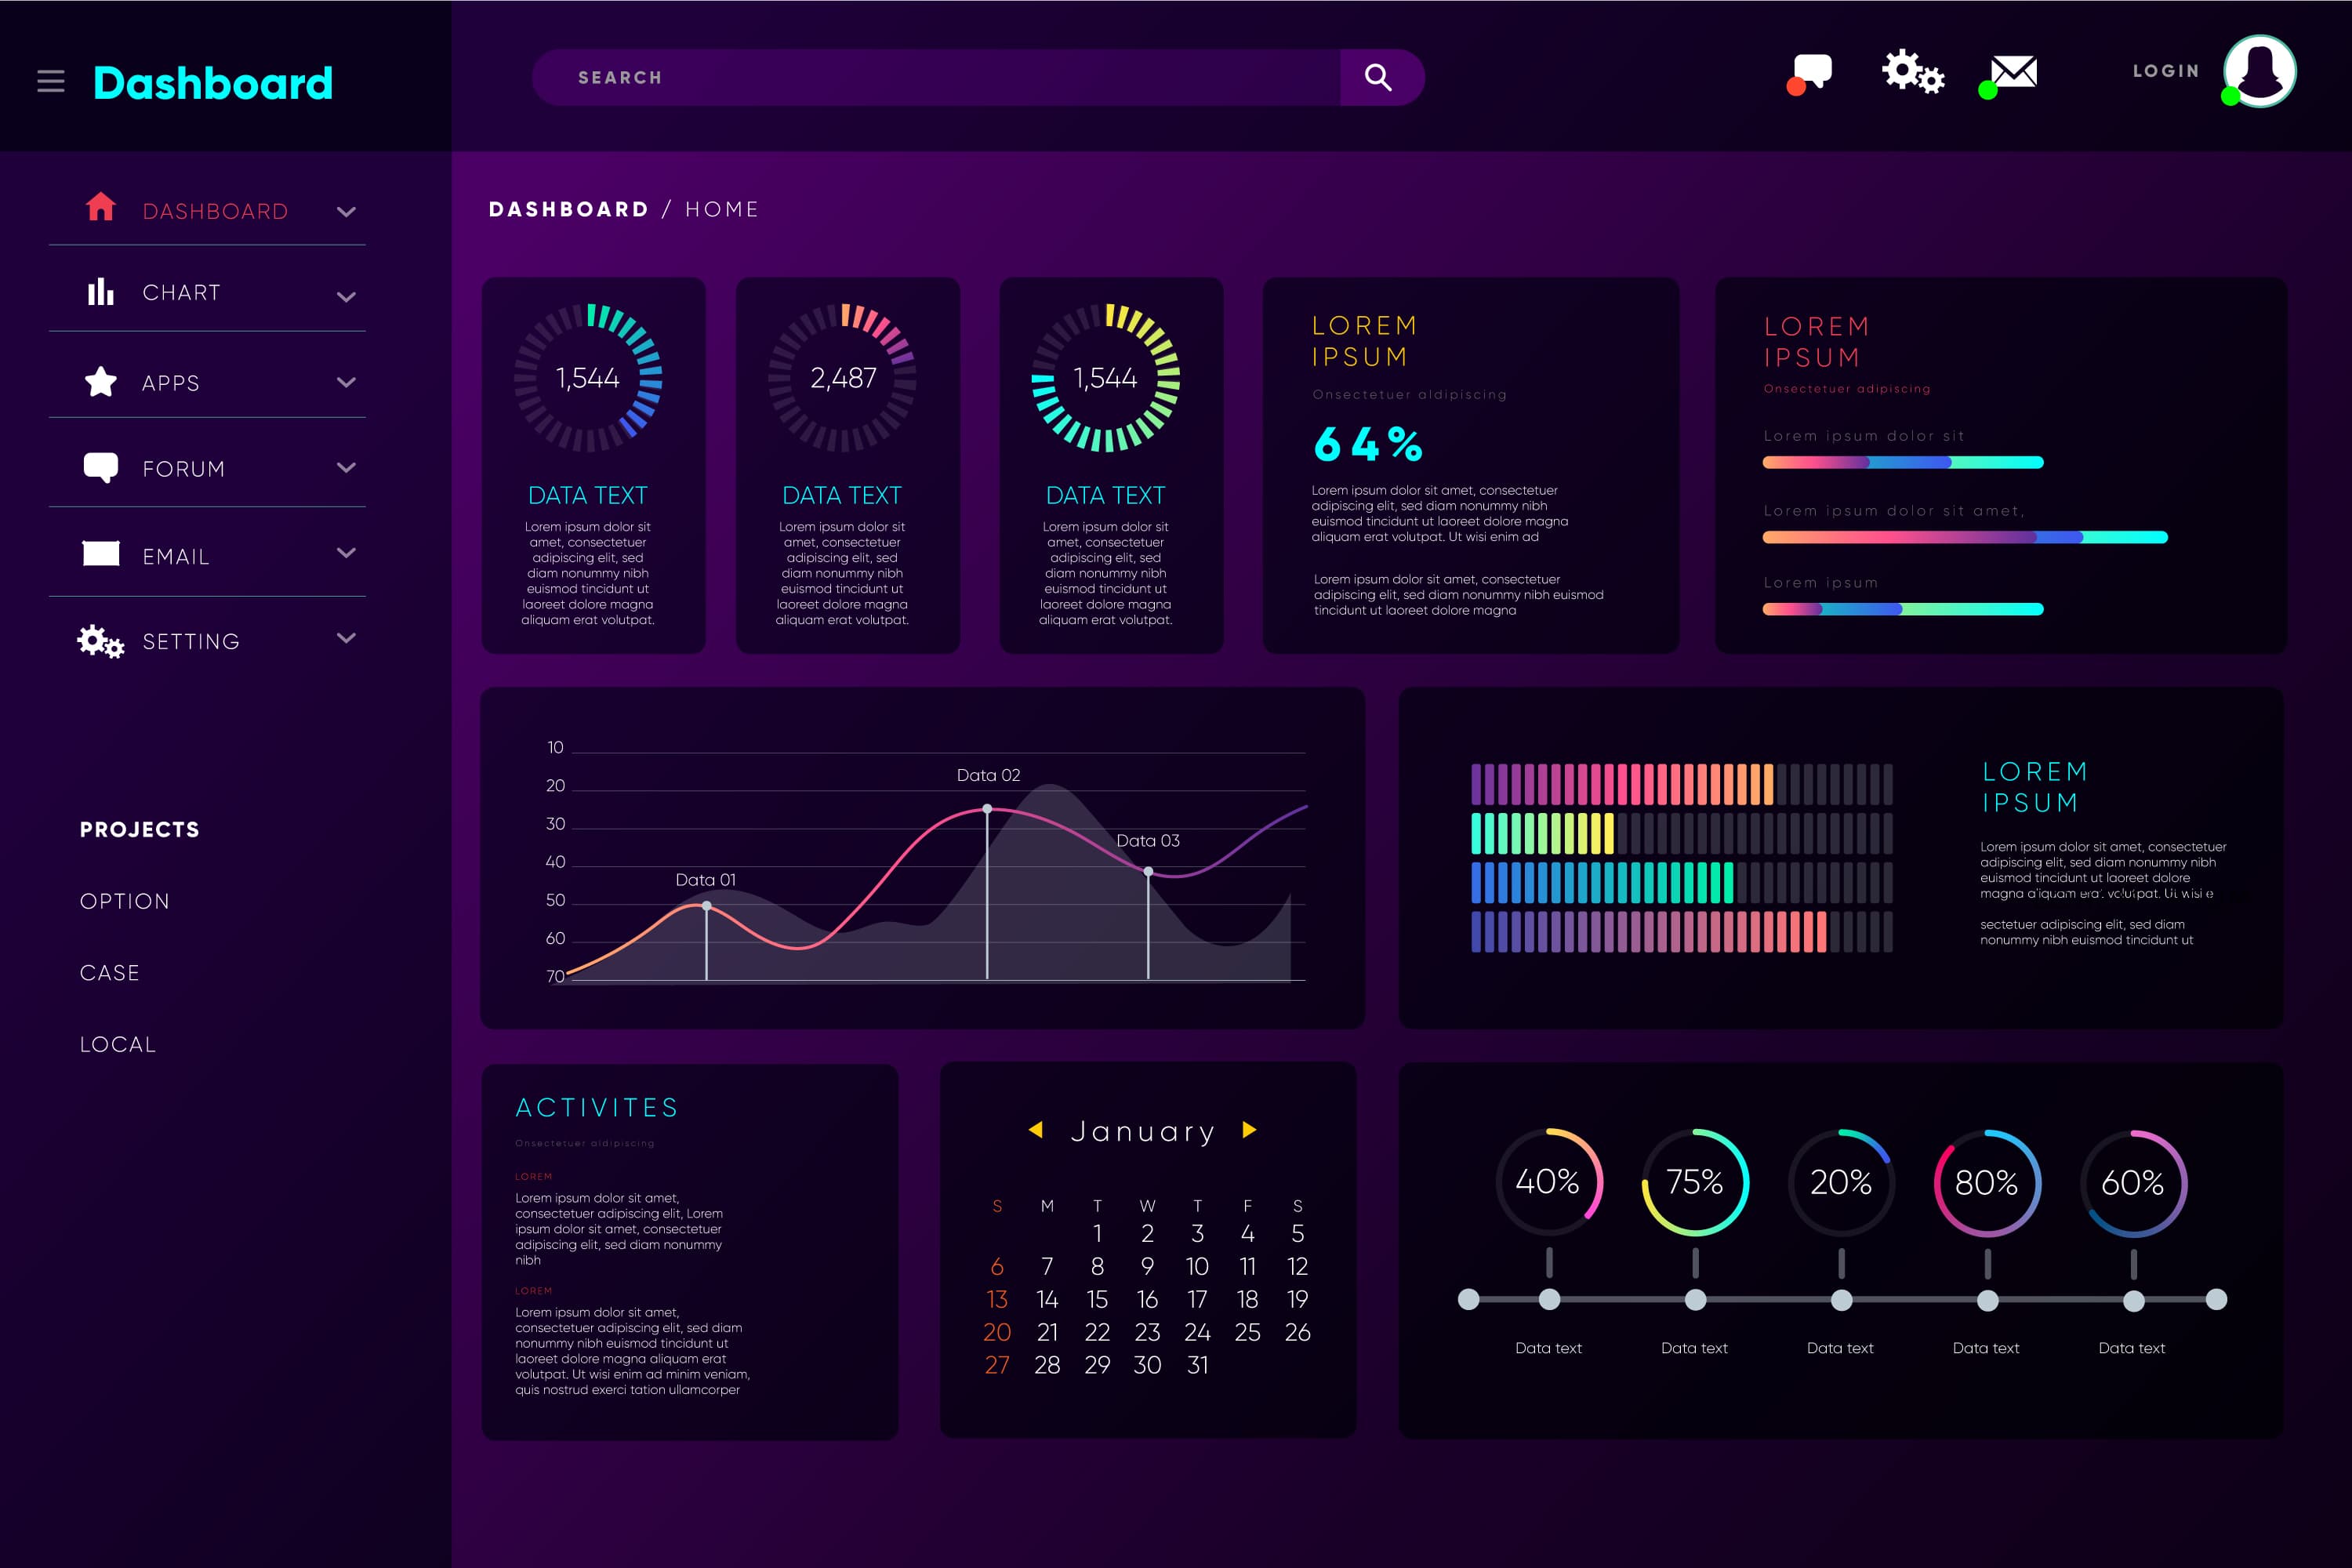
SaaS Analytics Dashboard
A real-time analytics platform demonstrating scalable data visualization and team collaboration capabilities.
Overview
What
A comprehensive analytics dashboard that provides real-time insights through customizable visualizations, data filtering, and collaborative features for teams.
Why
Built as a concept demonstration to showcase how modern web technologies can create powerful, responsive analytics interfaces that handle large datasets efficiently.
Key Features
Performance
Optimized queries and caching strategies enable smooth interactions with large datasets.
Scalability
Architecture supports horizontal scaling and can handle growing data volumes.
Security
Role-based access control and secure API authentication protect sensitive business data.
User Experience
Progressive data loading and smooth animations create a responsive user experience without feeling sluggish.
Problem Statement
Businesses need intuitive ways to visualize complex data in real-time. Traditional analytics tools often lack the flexibility for custom dashboards or require expensive enterprise solutions. This concept addresses the challenge of making data accessible and actionable for teams of any size.
Solution
The platform uses a component-based architecture with React for the UI layer, enabling rapid dashboard customization. Real-time updates are handled through WebSocket connections, while PostgreSQL manages time-series data efficiently. The design prioritizes clean, minimal interfaces that don't overwhelm users with information density.
Tech Stack
Frontend
Backend
Infrastructure
Tools
Outcome
This concept demonstrates our capability to build enterprise-grade analytics platforms. It's suitable for SaaS companies, e-commerce platforms, and any business requiring real-time data visualization and collaborative analytics tools.
This project is a concept demonstration created to showcase our technical capabilities.